


Revenue Snapshot Analysis
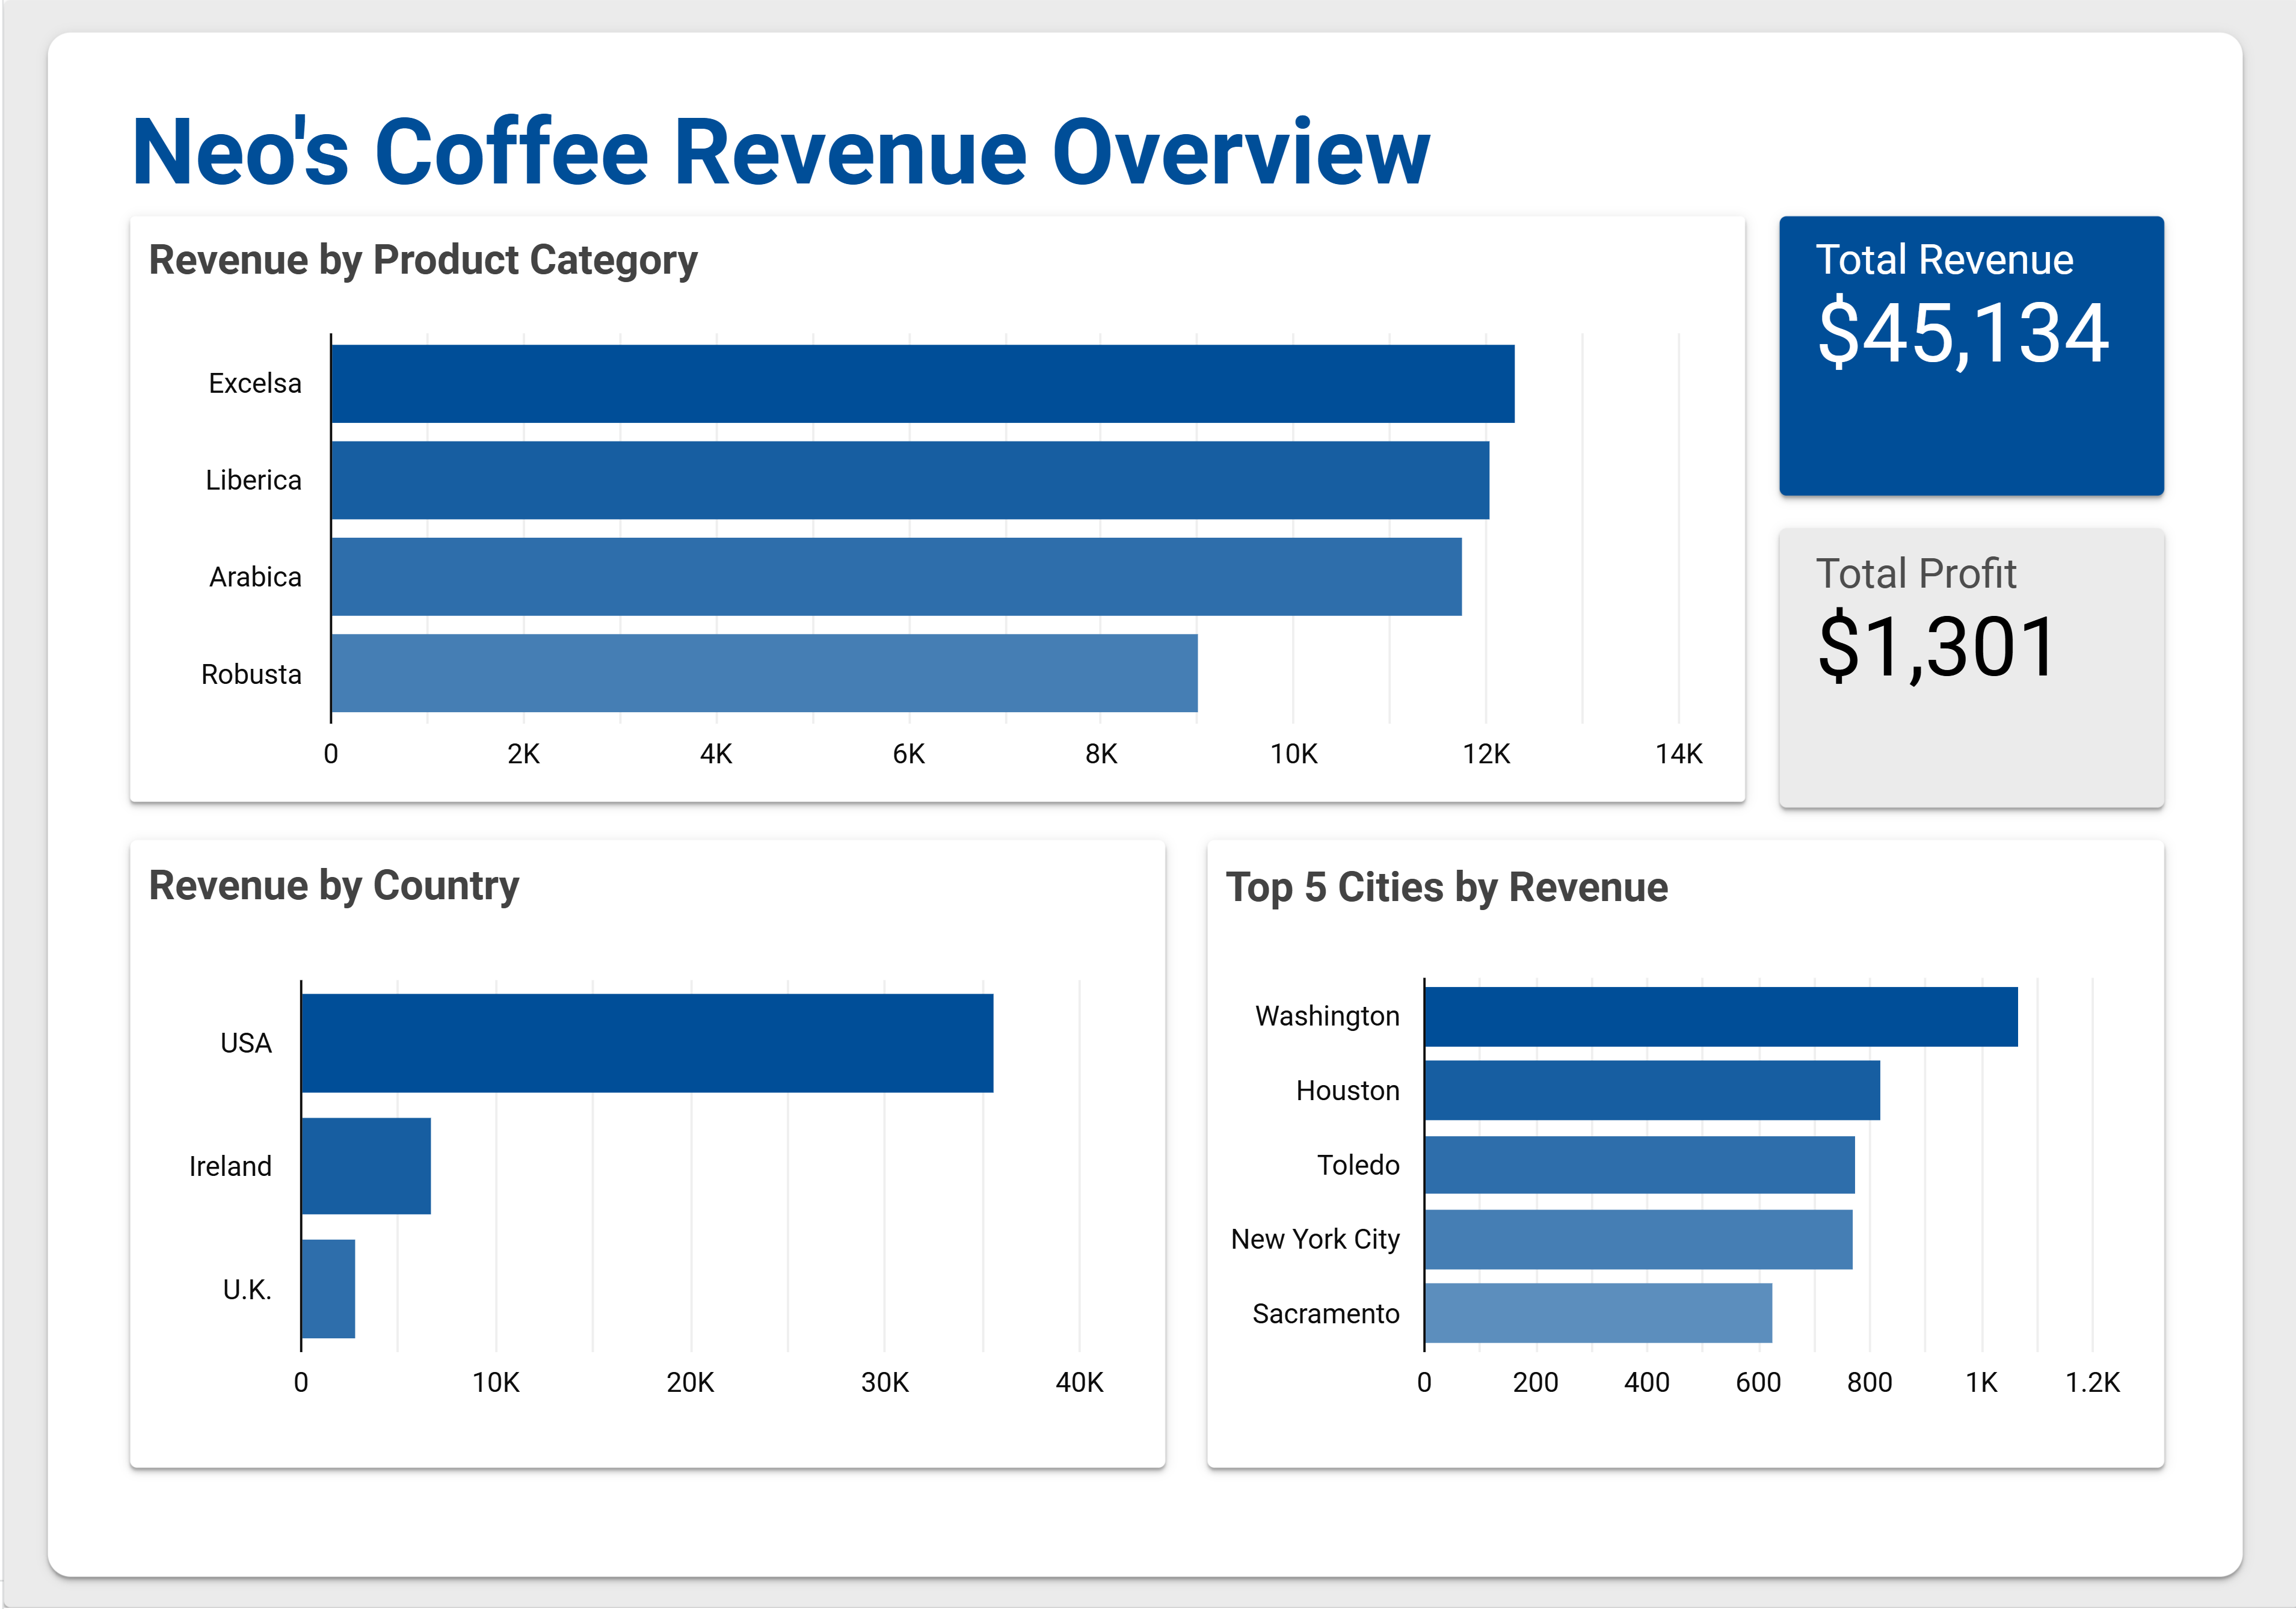
Excelsa coffee stands out as the top revenue generator at $12,306, significantly outperforming other varieties like Liberica, Arabica, and Robusta. This suggests Excelsa has strong market appeal or possibly higher pricing power.
The United States dominates revenue generation with over $35K, while international markets like Ireland and the U.K. contribute less than $10K each. This indicates a heavy reliance on the U.S. market with untapped potential abroad.
Customer Insights Analysis
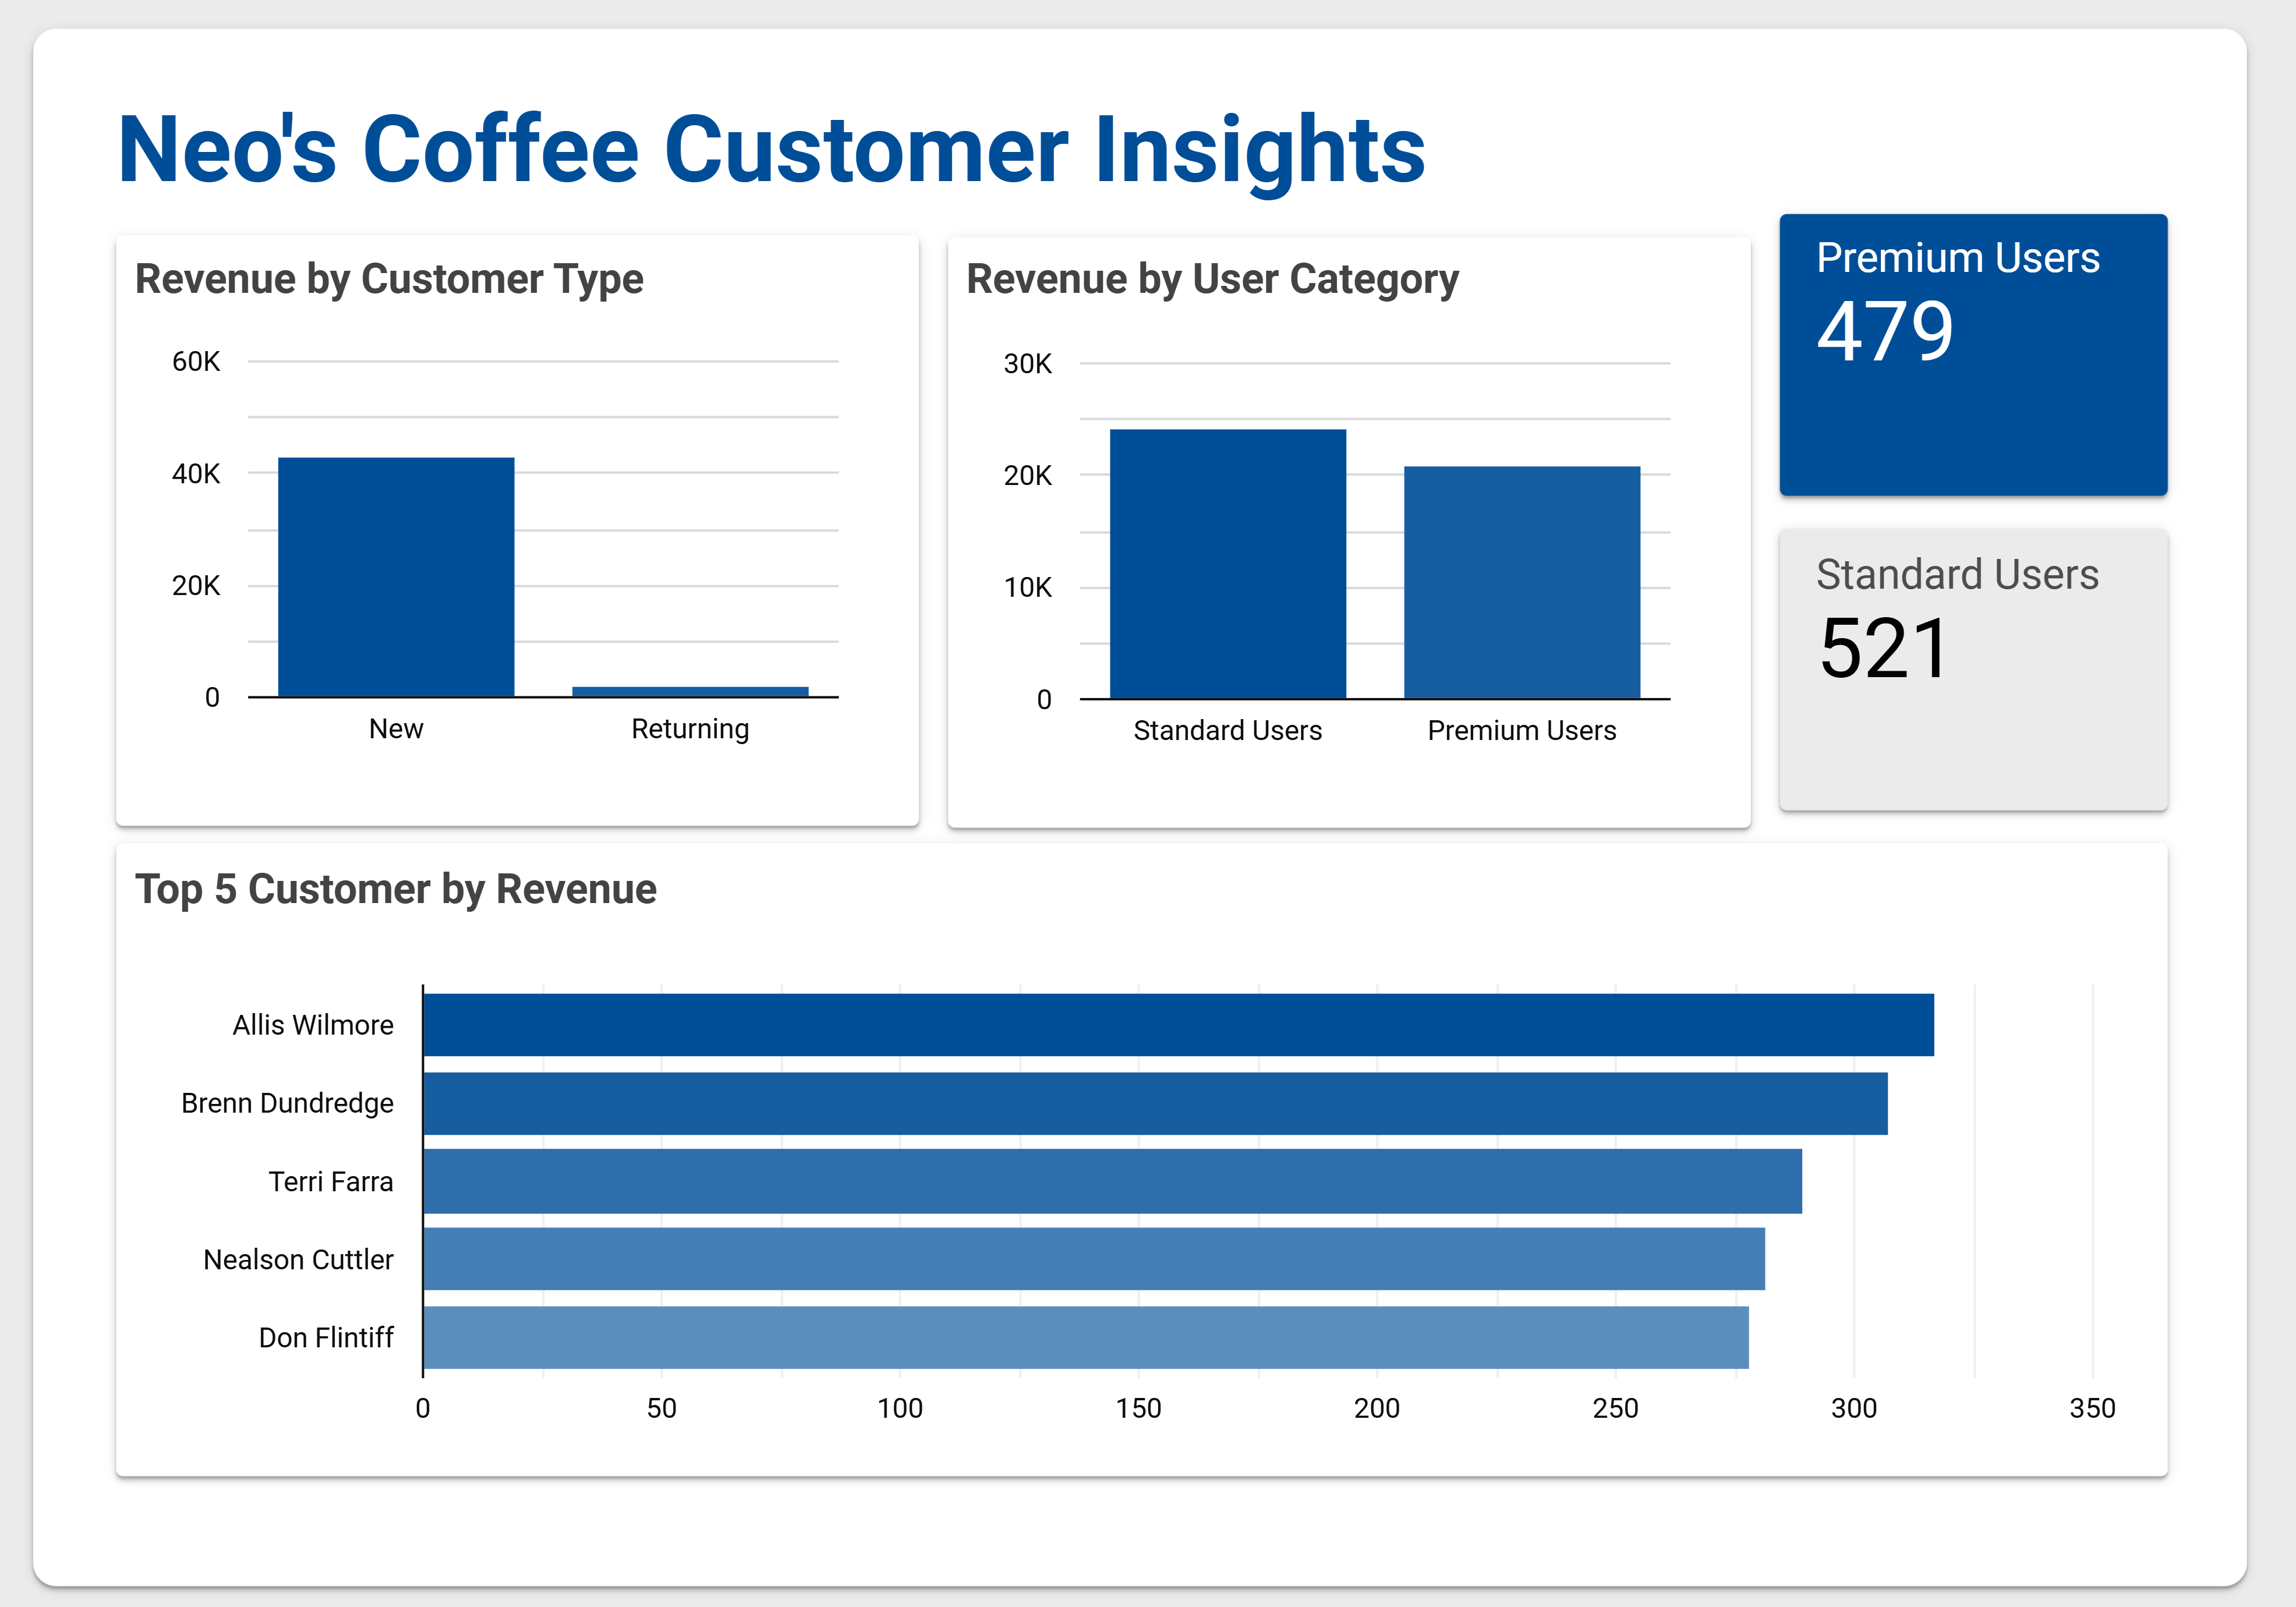
New customers generate approximately $40K in revenue compared to just $5K from returning customers. This 8:1 ratio indicates strong acquisition but weak retention strategies.
Despite having fewer members (479 vs 521), Premium users generate comparable revenue to Standard users ($20K vs $24K), suggesting Premium members have higher average order values but aren’t being effectively leveraged.
Performance Tracker Analysis
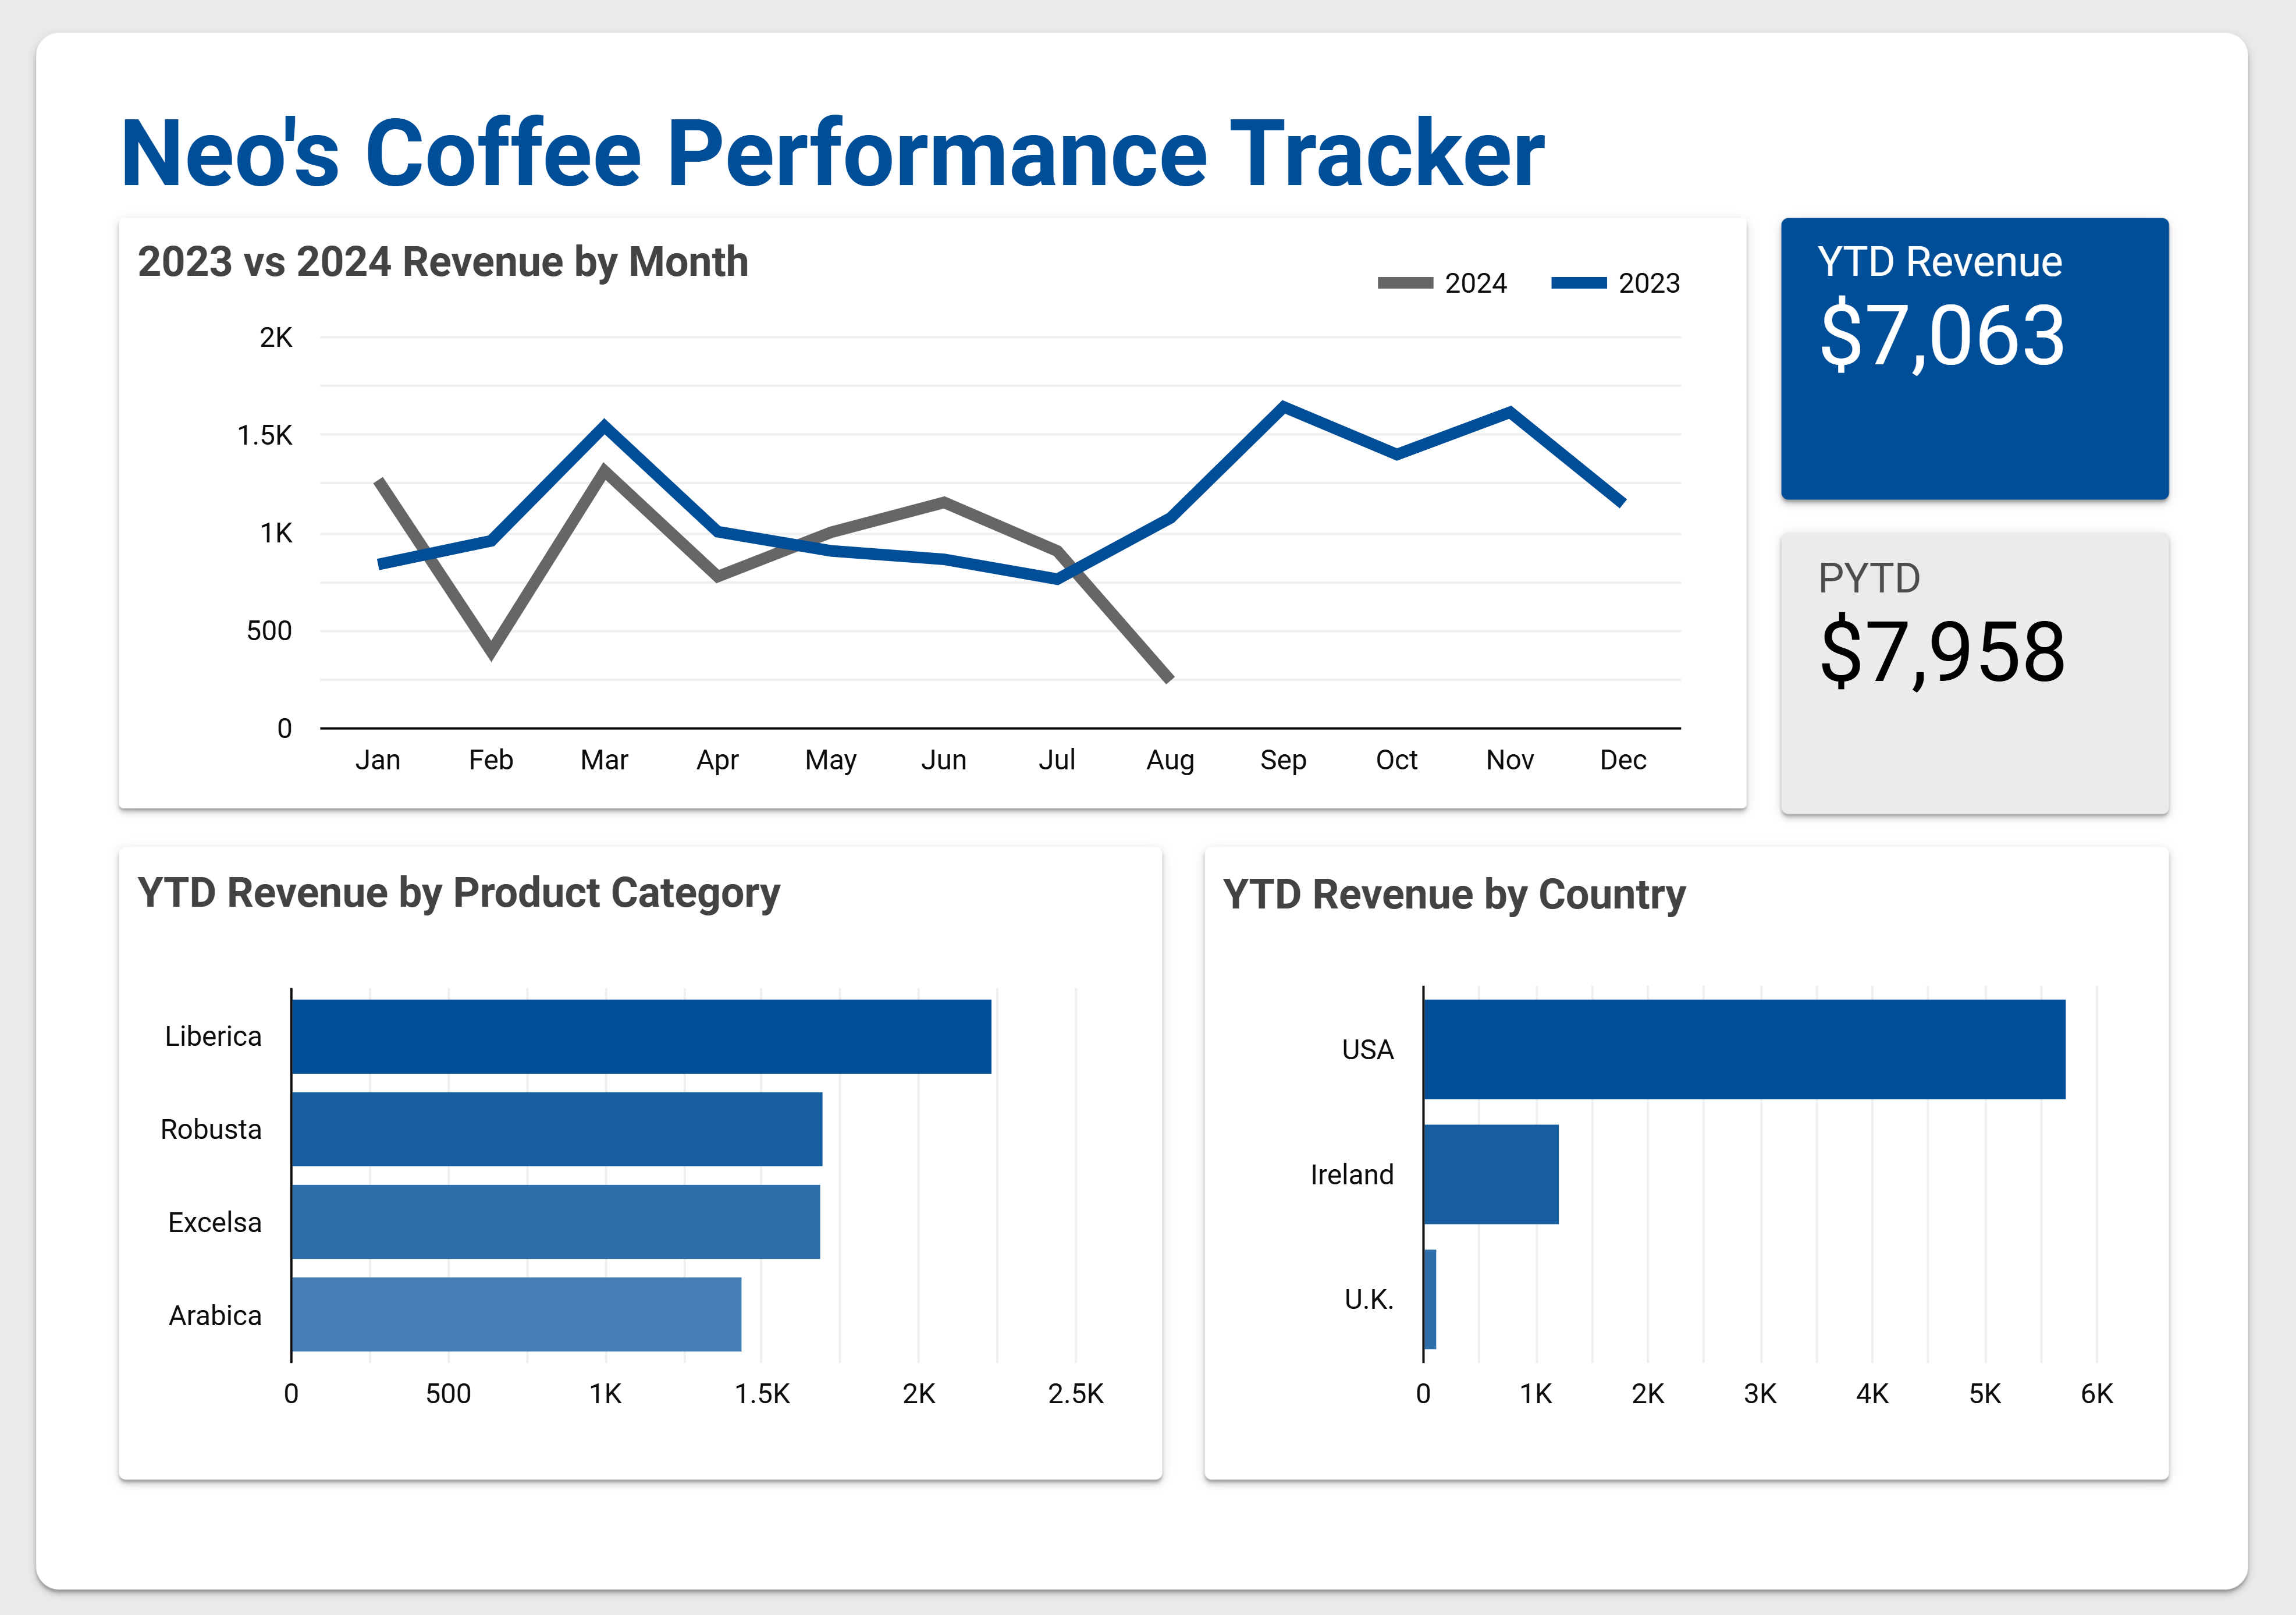
Year-over-year revenue shows an 11% decline ($7,063 in 2024 vs $7,958 in 2023), with particularly weak performance in August 2024 (below $500) compared to March’s peak ($1.3K).
Product performance shifts reveal Liberica as 2024’s top seller ($2K), while previously dominant Excelsa drops to $1.6K. The U.S. remains the strongest market ($5K) but international sales are minimal (under $1.5K each).
Growth Monitor Analysis
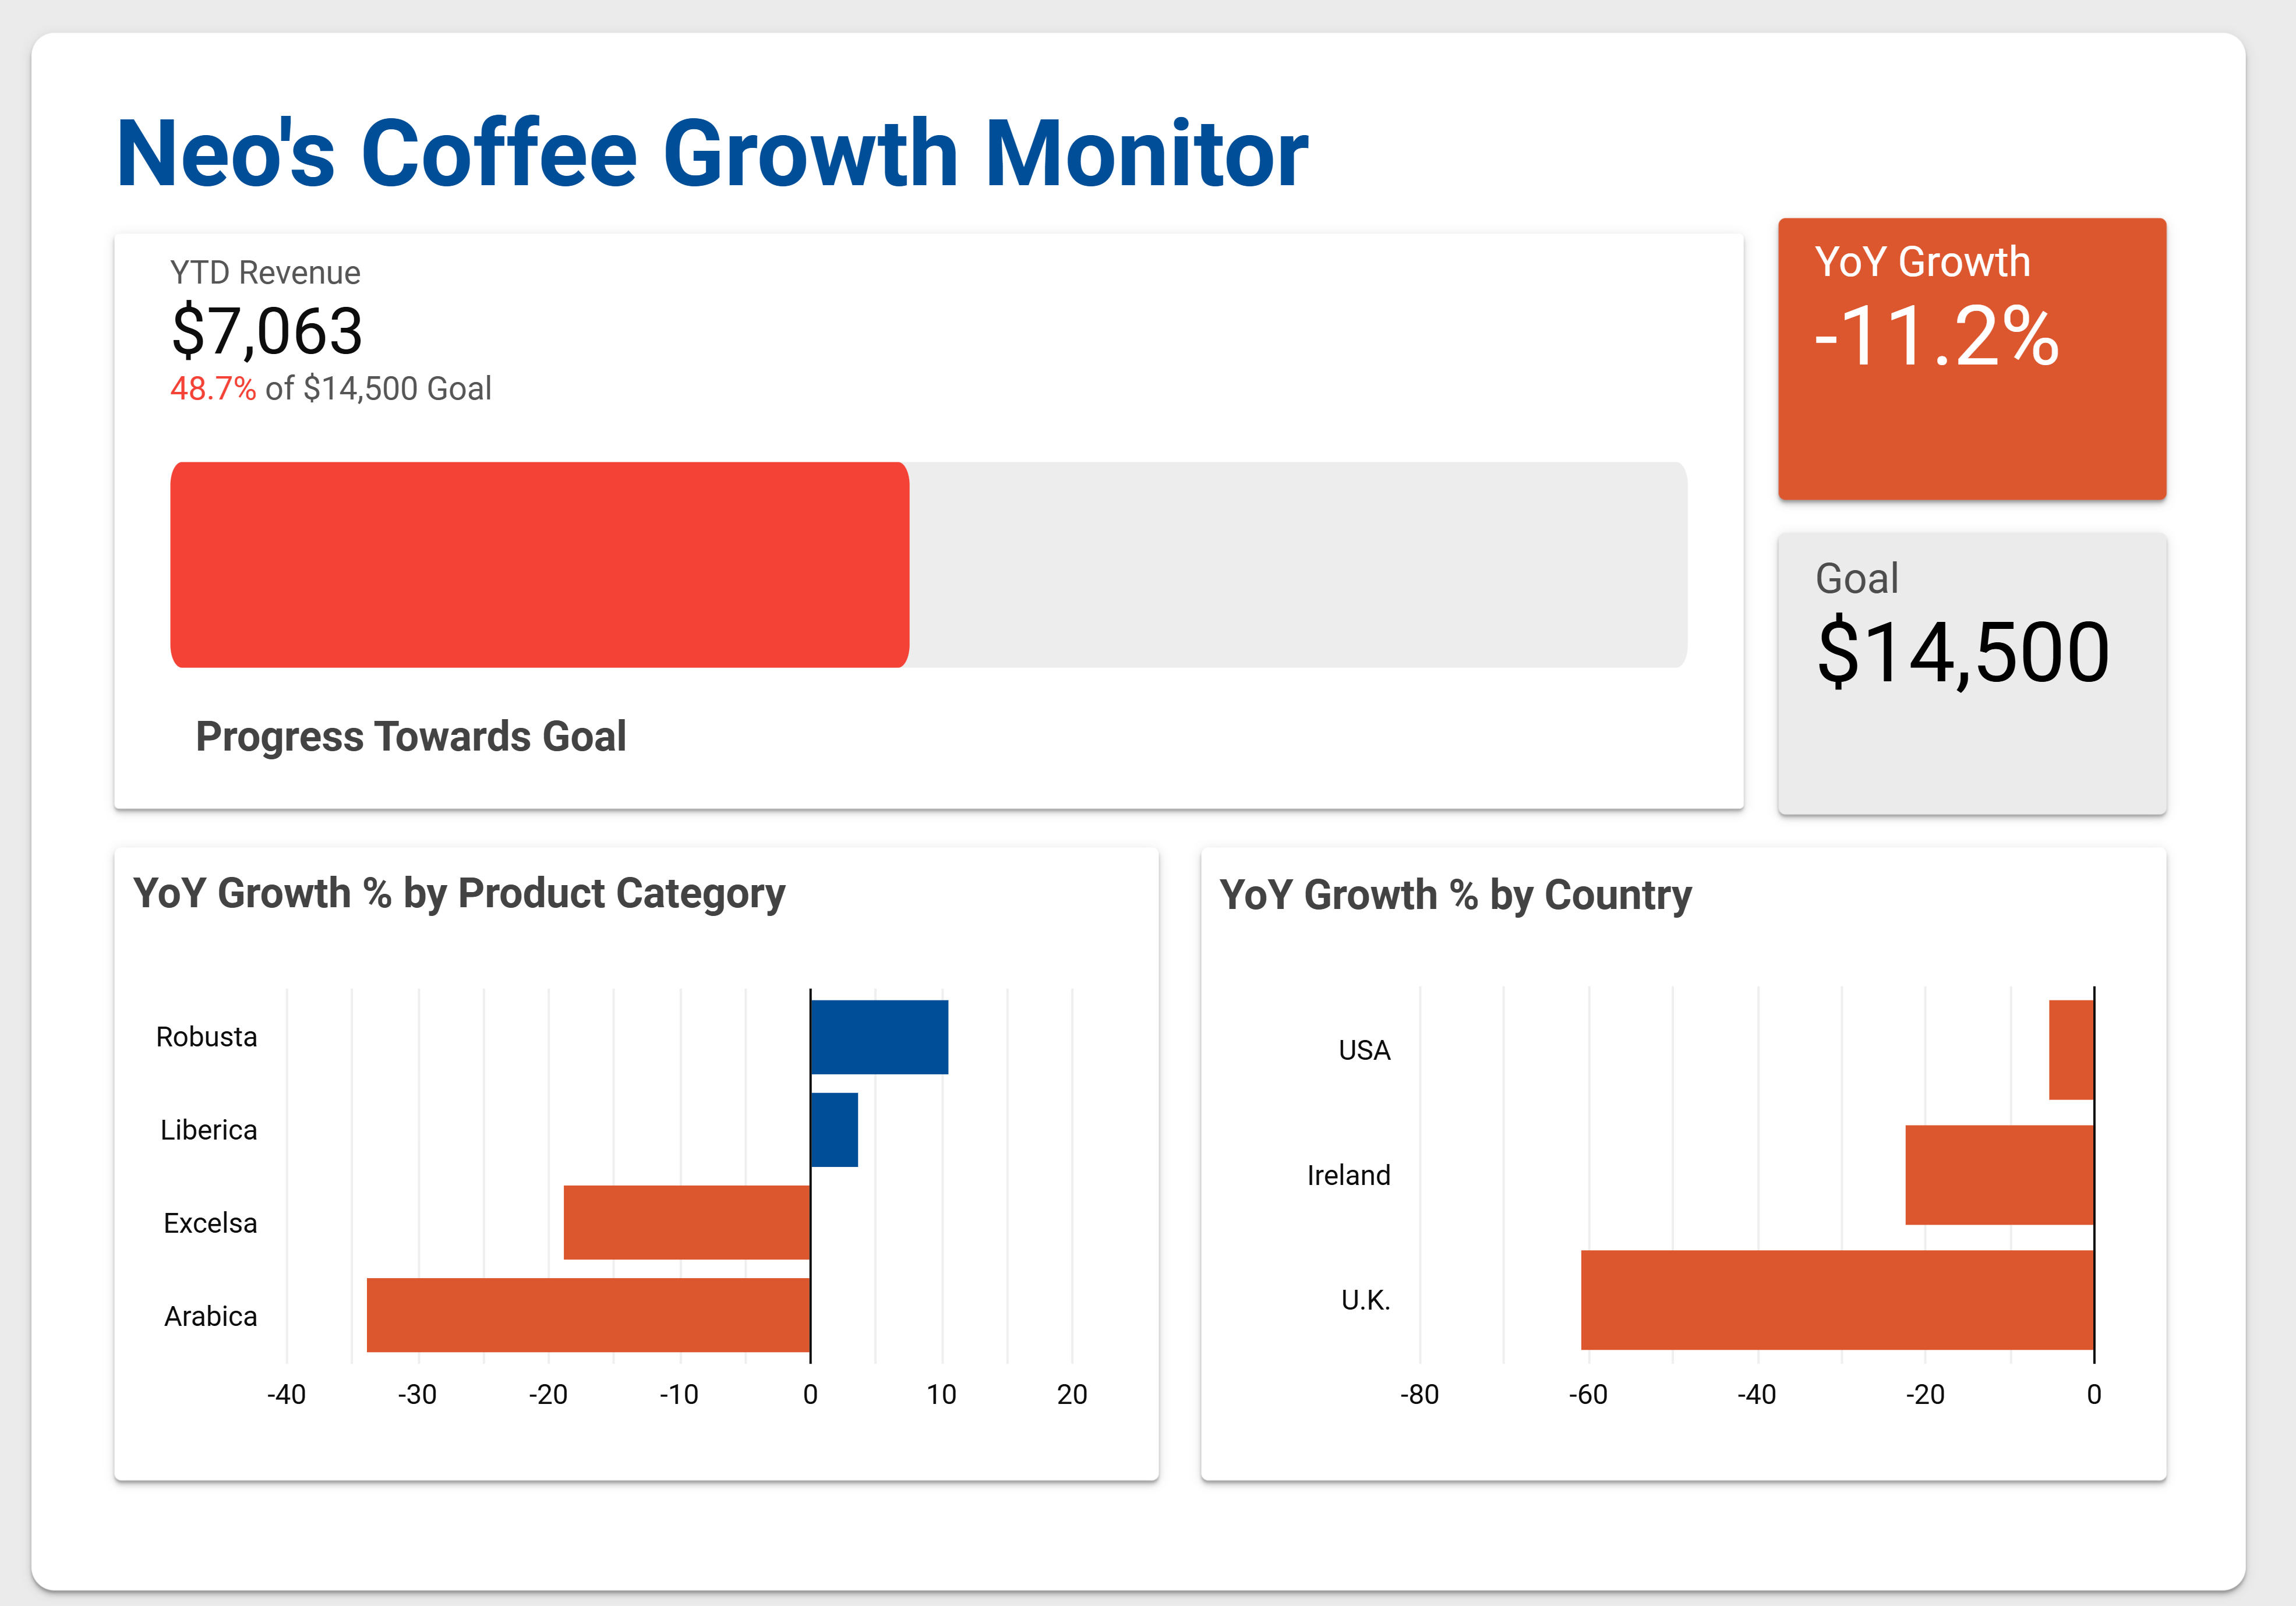
The business shows concerning declines: 11.24% overall revenue drop, with the U.K. market down 60%. Only Robusta shows positive growth (+10%) amidst widespread declines.
Current revenue ($7,061) represents just 48.7% of the $14,500 annual goal, requiring significant improvement to meet targets. The growth patterns indicate structural challenges rather than temporary fluctuations.
Neo’s Coffee Business Analytics
Data-Driven Solutions for a Growing Coffee Business
The Challenge
Neo, a dedicated teacher, has grown Neo’s Coffee, her e-commerce side hustle, for four years. Balancing both, she now aims to scale her business but lacks insights into what works, who her top customers are, and where to focus. This hinders attracting customers, boosting sales, and making data-driven decisions for growth.
Project Goal
I aim to grow Neo’s Coffee by analyzing data to answer three key questions: Who are the most valuable customers, identifying top buyers and their reasons for returning; which products sell best, pinpointing top coffee types and untapped sales opportunities; and where the business can expand, exploring new markets or strategies to reach more customers and boost sales.
Key Insights from the Data
Click on any chart to enlarge | Click “More Info” for detailed analysis
Revenue Snapshot
Customer Insights Hub
Performance Tracker
Growth Monitor
Summary of Findings
Revenue Concentration
Excelsa coffee and U.S. market dominate revenue but show concerning declines, with overall revenue down 11.24% year-over-year.
Customer Retention
New customers drive most revenue ($40K vs $5K from returning), indicating weak retention strategies despite 479 Premium members.
International Weakness
U.K. sales plummeted 60% while Ireland remains minimal, creating dangerous over-reliance on U.S. market.
Product Shifts
Liberica surpassed Excelsa in 2024, while Robusta shows 10% growth – the only positive trend amidst widespread declines.
Goal Progress
At 48.7% of $14,500 annual target, business needs significant Q3-Q4 improvement to meet goals.
Profit Challenges
Just $1,301 profit on $45,134 revenue (2.9% margin) indicates serious cost structure issues.
Recommended Actions
1. Boost International Sales
U.K. sales dropped 60%, and Ireland’s contribution is minimal. Targeted campaigns can revive international growth.
2. Improve Customer Retention
New customers dominate revenue. Loyalty programs can boost repeat purchases.
3. Optimize Product Mix
Robusta grows 10%, but Excelsa declined 20%. Adjust offerings to maximize revenue.
Technical Details
This section is for data analysts, data scientists, or anyone who wants to see the code behind our analysis. Click the links below to explore different parts of the project:
Detailed documentation of the data processing steps used in this analysis.
View NotebookExplore the complete dashboard with all metrics and visualizations.
View DashboardDownload the original dataset used for this analysis for your own exploration.
Download Dataset